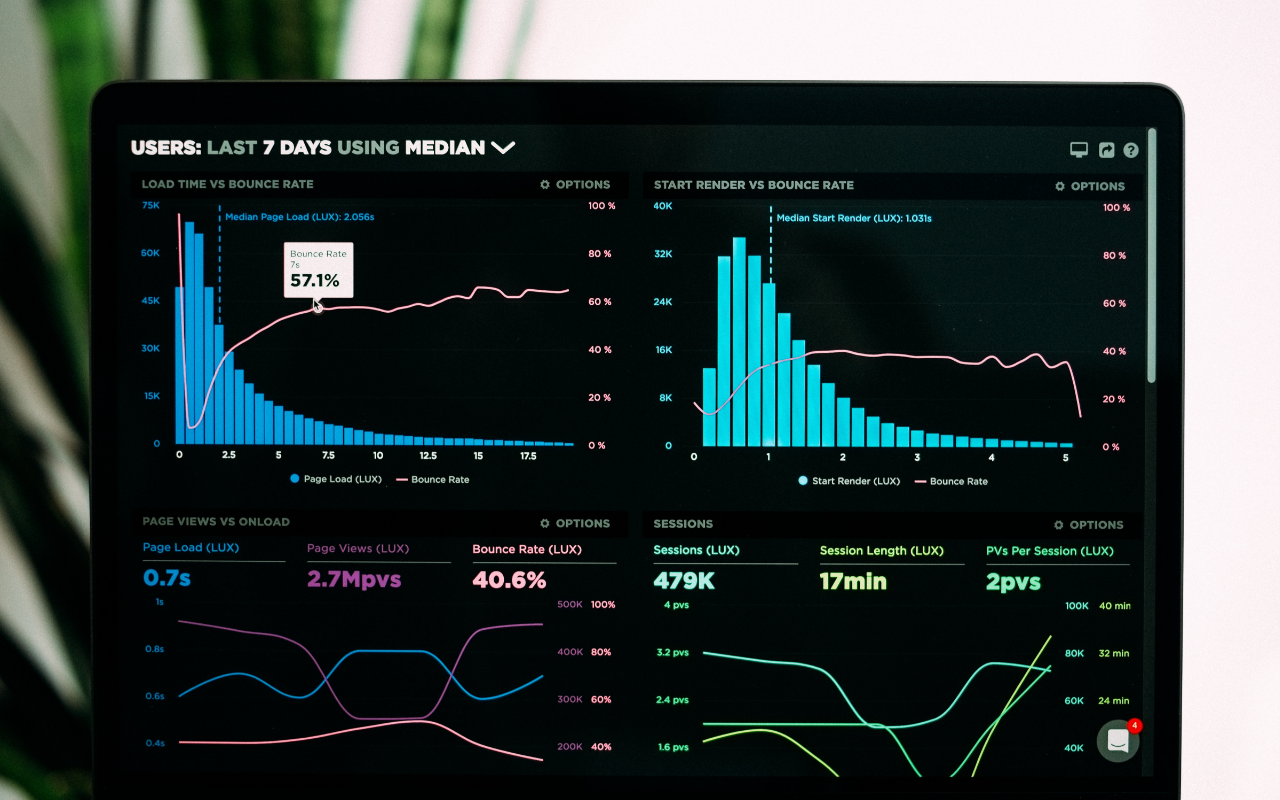
Seeing is Believing
The Importance of Data Visualisation in Data-Driven Decision Making
3 Minute Read
AI and Data, Strategy in Action

As businesses strive to become more data-driven, one of the most important aspects of this transformation is effective data visualisation. While data can be a powerful tool for informing decision-making, it is only as useful as the insights it provides, and those insights can be difficult to glean from raw data alone. Data visualisation is the process of using graphical representations to make complex data more accessible, intuitive, and actionable.
In this article, we will explore the importance of data visualisation in data-driven decision making, the benefits of effective data visualisation, and some best practices for creating compelling data visualisations.
Why Data Visualisation Matters
Data visualisation can help businesses in a number of ways. Here are just a few of the key benefits:
Better Understanding of Complex Data
When data is presented visually, it is often easier to understand and interpret. visualisations can help reveal patterns and trends that might be difficult to discern from raw data alone.
Improved Communication
visualisations can be a powerful tool for communicating complex data to both technical and non-technical audiences. By presenting data in a clear and compelling way, businesses can improve decision-making by ensuring that everyone is on the same page.
More Effective Decision-Making
By making it easier to understand complex data, data visualisation can help businesses make more informed decisions. It can also help identify potential issues or opportunities that might be missed when data is presented in a more traditional format.
Best Practices for Data Visualisation
Here are some best practices to keep in mind when creating data visualisations:
Simplicity
Keep your visualisations as simple as possible. Too much complexity can be overwhelming and can obscure the insights you're trying to communicate.
Relevance
Make sure your visualisations are relevant to the questions you're trying to answer or the insights you're trying to communicate. Don't include data that doesn't help support your argument or add value to your insights.
Accuracy
Ensure that your visualisations are accurate and clearly labeled. Misleading visualisations can be worse than no visualisations at all.
Consistency
Use consistent formatting, colors, and labeling across all of your visualisations. This will make it easier for your audience to understand and interpret the data.
Branded
In the social-media age, data visualisations are easily shared. If you are visualising data for a business, or even as an individual, making sure your visualisations are branded helps develop your brand, i.e. FiveThirtyEight, The Guardian, and the BBC all have recognisable data visualisation branding.
How Demonstrandum Can Help
At Demonstrandum, we understand the importance of effective data visualisation in data-driven decision making. We can help your business develop custom visualisations that provide clear and compelling insights into your data. Our team of data experts can work with you to identify the key questions you need to answer and design visualisations that help you answer them.
By partnering with Demonstrandum, you can unlock the full potential of your data and drive sustainable growth for your business. Contact us today to learn more about how we can help you unlock the power of your data.